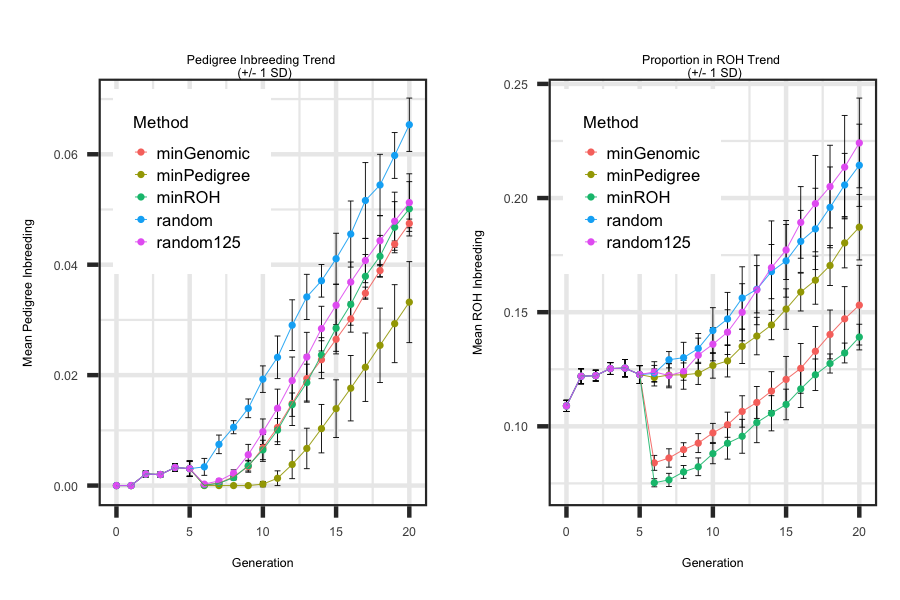
Similar to the previous example, a bash script is outlined below that illustrates the impact of different mating designs on the inbreeding
levels in the progeny. A total of four mating design methods are simulated and include random, random125, minPedigree, minROH and minGenomic. A total of
5 replicates were generated. After a scenario is done the directory where the replicates are saved is renamed within the bash script.
Similar to Example 6, the important files are saved within the renamed replicate folder within each scenario. The replicate number is appended to the file name.
The bash script above renames the replicate directories to "reps_random", "reps_random125", "reps_minPedigree", "minROH" and "reps_minGenomic " for the random, random125,
minPedigree, minROH and minGenomic, respectively.
Outlined below is a more detailed explanation of the major differences in the mating designs across the different scenarios:
- random: Parents are mated at random.
- random125: In order to avoid the mating of closely related animals, parents with a relationship greater than 0.125 were avoided. Any
relationship that is below this value was changed to a value of zero and as a result mating was done at random. The log file provides information on how many
matings were initially over the 0.125 threshold prior to the simulated annealing optimization method and after optimization was conducted.
- minPedigree: The average pedigree-based relationship between parents was minimized across all parents using the simulated
annealing optimization method. Similar to random125, the average parental pedigree-based relationship prior to and after optimization is outlined in the log file.
- minROH: The average ROH-based relationship between parents was minimized across all parents using the simulated
annealing optimization method. Similar to random125, the average parental ROH-based relationship prior to and after optimization is outlined in the log file.
- minGenomic: The average genomic-based relationship between parents was minimized across all parents using the simulated
annealing optimization method. Similar to random125, the average parental genomic-based relationship prior to and after optimization is outlined in the log file.
Utilizing the R code outlined below the following plot was generated to illustrate how to loop through each scenario and generate plots
that describe the impact of a mating design on the level of pedigree and genomic inbreeding. As outlined below genomic information allows for one to
estimate the relationships between the founders that are assumed unrelated with pedigree information. As a result a large drop in genomic inbreeding is seen
when minimizing with genomic information compared to pedigree-based information.
R-Code
rm(list=ls()); gc()
library(ggplot2); library(tidyverse)
wd <- "/Users/jeremyhoward/Documents/39_GenoDiver_C++Code/WebsiteExamples/Example14/"
scen <- c("reps_random","reps_random125","reps_minPedigree","reps_minROH","reps_minGenomic")
reps <- c(1500:1514)
for(i in 1:length(scen))
{
for(j in 1:length(reps))
{
filename <- paste(wd,scen[i],"/Summary_Statistics_DataFrame_Inbreeding_",reps[j],sep="")
df <- read_table2(file=filename,col_names = TRUE,col_type = "dcccccccccccccc") %>%
mutate(inbf = as.numeric(matrix(unlist(strsplit(ped_f, "[()]")), ncol = 2, byrow = TRUE)[, 1]),
inbroh = as.numeric(matrix(unlist(strsplit(PropROH, "[()]")), ncol = 2, byrow = TRUE)[, 1]),
Method = unlist(strsplit(scen[i],"_"))[2], Rep = reps[j]) %>%
select(Generation,Method,inbf,inbroh)
if(j == 1 & i == 1){summarytable <- df}
if(j > 1 | i > 1){summarytable <- rbind(summarytable,df);}
}
}
means <- aggregate(inbf ~ Generation + Method, data=summarytable,FUN=mean)
sds <- aggregate(inbf ~ Generation + Method, data=summarytable,FUN=sd)
plotdf <- cbind(means,sds[,3]); rm(means,sds)
names(plotdf) <- c("Generation","Method","Mean","SD")
pd <- position_dodge(0.5)
ggplot(plotdf, aes(x=Generation, y=Mean, colour=Method)) +
geom_errorbar(aes(ymin=Mean-SD, ymax=Mean+SD), colour="black", width=.4, size = 0.5, position=pd) +
geom_point(size=2.0) + geom_line(size=0.50) + theme_bw() +
labs(title = "Pedigree Inbreeding Trend \n (+/- 1 SD)", x = "Generation", y = "Mean Pedigree Inbreeding") +
theme(plot.title = element_text(size = 16,hjust = 0.5),axis.title = element_text(size = 12),
legend.position="bottom",axis.text=element_text(size=10))
means <- aggregate(inbroh ~ Generation + Method, data=summarytable,FUN=mean)
sds <- aggregate(inbroh ~ Generation + Method, data=summarytable,FUN=sd)
plotdf <- cbind(means,sds[,3]); rm(means,sds)
names(plotdf) <- c("Generation","Method","Mean","SD")
pd <- position_dodge(0.5)
ggplot(plotdf, aes(x=Generation, y=Mean, colour=Method)) +
geom_errorbar(aes(ymin=Mean-SD, ymax=Mean+SD), colour="black", width=.4, size = 0.5, position=pd) +
geom_point(size=2.0) + geom_line(size=0.50) + theme_bw() +
labs(title = "Proportion in ROH Trend \n (+/- 1 SD)", x = "Generation", y = "Mean ROH Inbreeding") +
theme(plot.title = element_text(size = 16,hjust = 0.5),axis.title = element_text(size = 12),
legend.position="bottom",axis.text=element_text(size=10))


